


Volumetric brain tumour detection from MRI using visual saliency
- 0 Collaborators
Medical image processing has become a major player in the world of automatic tumour region detection and is tantamount to the incipient stages of computer aided design. Saliency detection is a crucial application of medical image processing, and serves in its potential aid to medical practitioners by making the affected area stand out in the foreground from the rest of the background image. The algorithm developed here is a new approach to the detection of saliency in a three dimensional multi channel MR image sequence for the glioblastoma multiforme (a form of malignant brain tumour). First we enhance the three channels, FLAIR (Fluid Attenuated Inversion Recovery), T2 and T1C (contrast enhanced with gadolinium) to generate a pseudo coloured RGB image. This is then converted to the CIE L*a*b* color space. Processing on cubes of sizes k = 4, 8, 16, the L*a*b* 3D image is then compressed into volumetric units; each representing the neighbourhood information of the surrounding 64 voxels for k = 4, 512 voxels for k = 8 and 4096 voxels for k = 16, respectively. The spatial distance of these voxels are then compared along the three major axes to generate the novel 3D saliency map of a 3D image, which unambiguously highlights the tumour region. The algorithm operates along the three major axes to maximise the computation efficiency while minimising loss of valuable 3D information. Thus the 3D multichannel MR image saliency detection algorithm is useful in generating a uniform and logistically correct 3D saliency map with pragmatic applicability in Computer Aided Detection (CADe). Assignment of uniform importance to all three axes proves to be an important factor in volumetric processing, which helps in noise reduction and reduces the possibility of compromising essential information. The effectiveness of the algorithm was evaluated over the BRATS MICCAI 2015 dataset having 274 glioma cases, consisting both of high grade and low grade GBM. The results were compared with that of the 2D saliency detection algorithm taken over the entire sequence of brain data. For all comparisons, the Area Under the receiver operator characteristic (ROC) Curve (AUC) has been found to be more than 0.99 ± 0.01 over various tumour types, structures and locations. ...learn more
Project status: Published/In Market
Groups
Student Developers for AI
Overview / Usage
Computer-Aided Detection (CADe) focuses on an automated and fast detection, localization and segmentation of the VOI. Here we developed a novel volumetric saliency-based algorithm for the efficient detection of GBM tumor(s) from multi-channel MRI. The formation of a 3D view representing the saliency of the tumour region in the entire brain is useful to generate a proper outline of the tumour area. When the boundaries are well defined then the malignancy of the tumour can be properly estimated by the medical practitioners. This will help in upholding the integrity of the term CADe, as the entirety of the tumour region can be detected.
While saliency detection in the 2D version of the algorithm (BA) was used to estimate only on a single cross sectional view of the tumour, the new 3D volumetric saliency detection algorithm (PR) enabled a more complete detection of the existing tumour(s) as estimated over the 3D image of the human brain. This contribution is of utmost significance due to its pragmatic usability and potential applicability in real time saliency detection for patients suffering from GBM. Use of the 3D approach is shown to elicit more accurate VOIs (as compared to the ground truth), both on qualitative and quantitative terms, by minimizing loss of valuable information with respect to the 3D extrapolation of the previous 2D version . This is expected to lead to improved segmentation and extraction of radiomic features, for subsequent decision-making.
Methodology / Approach
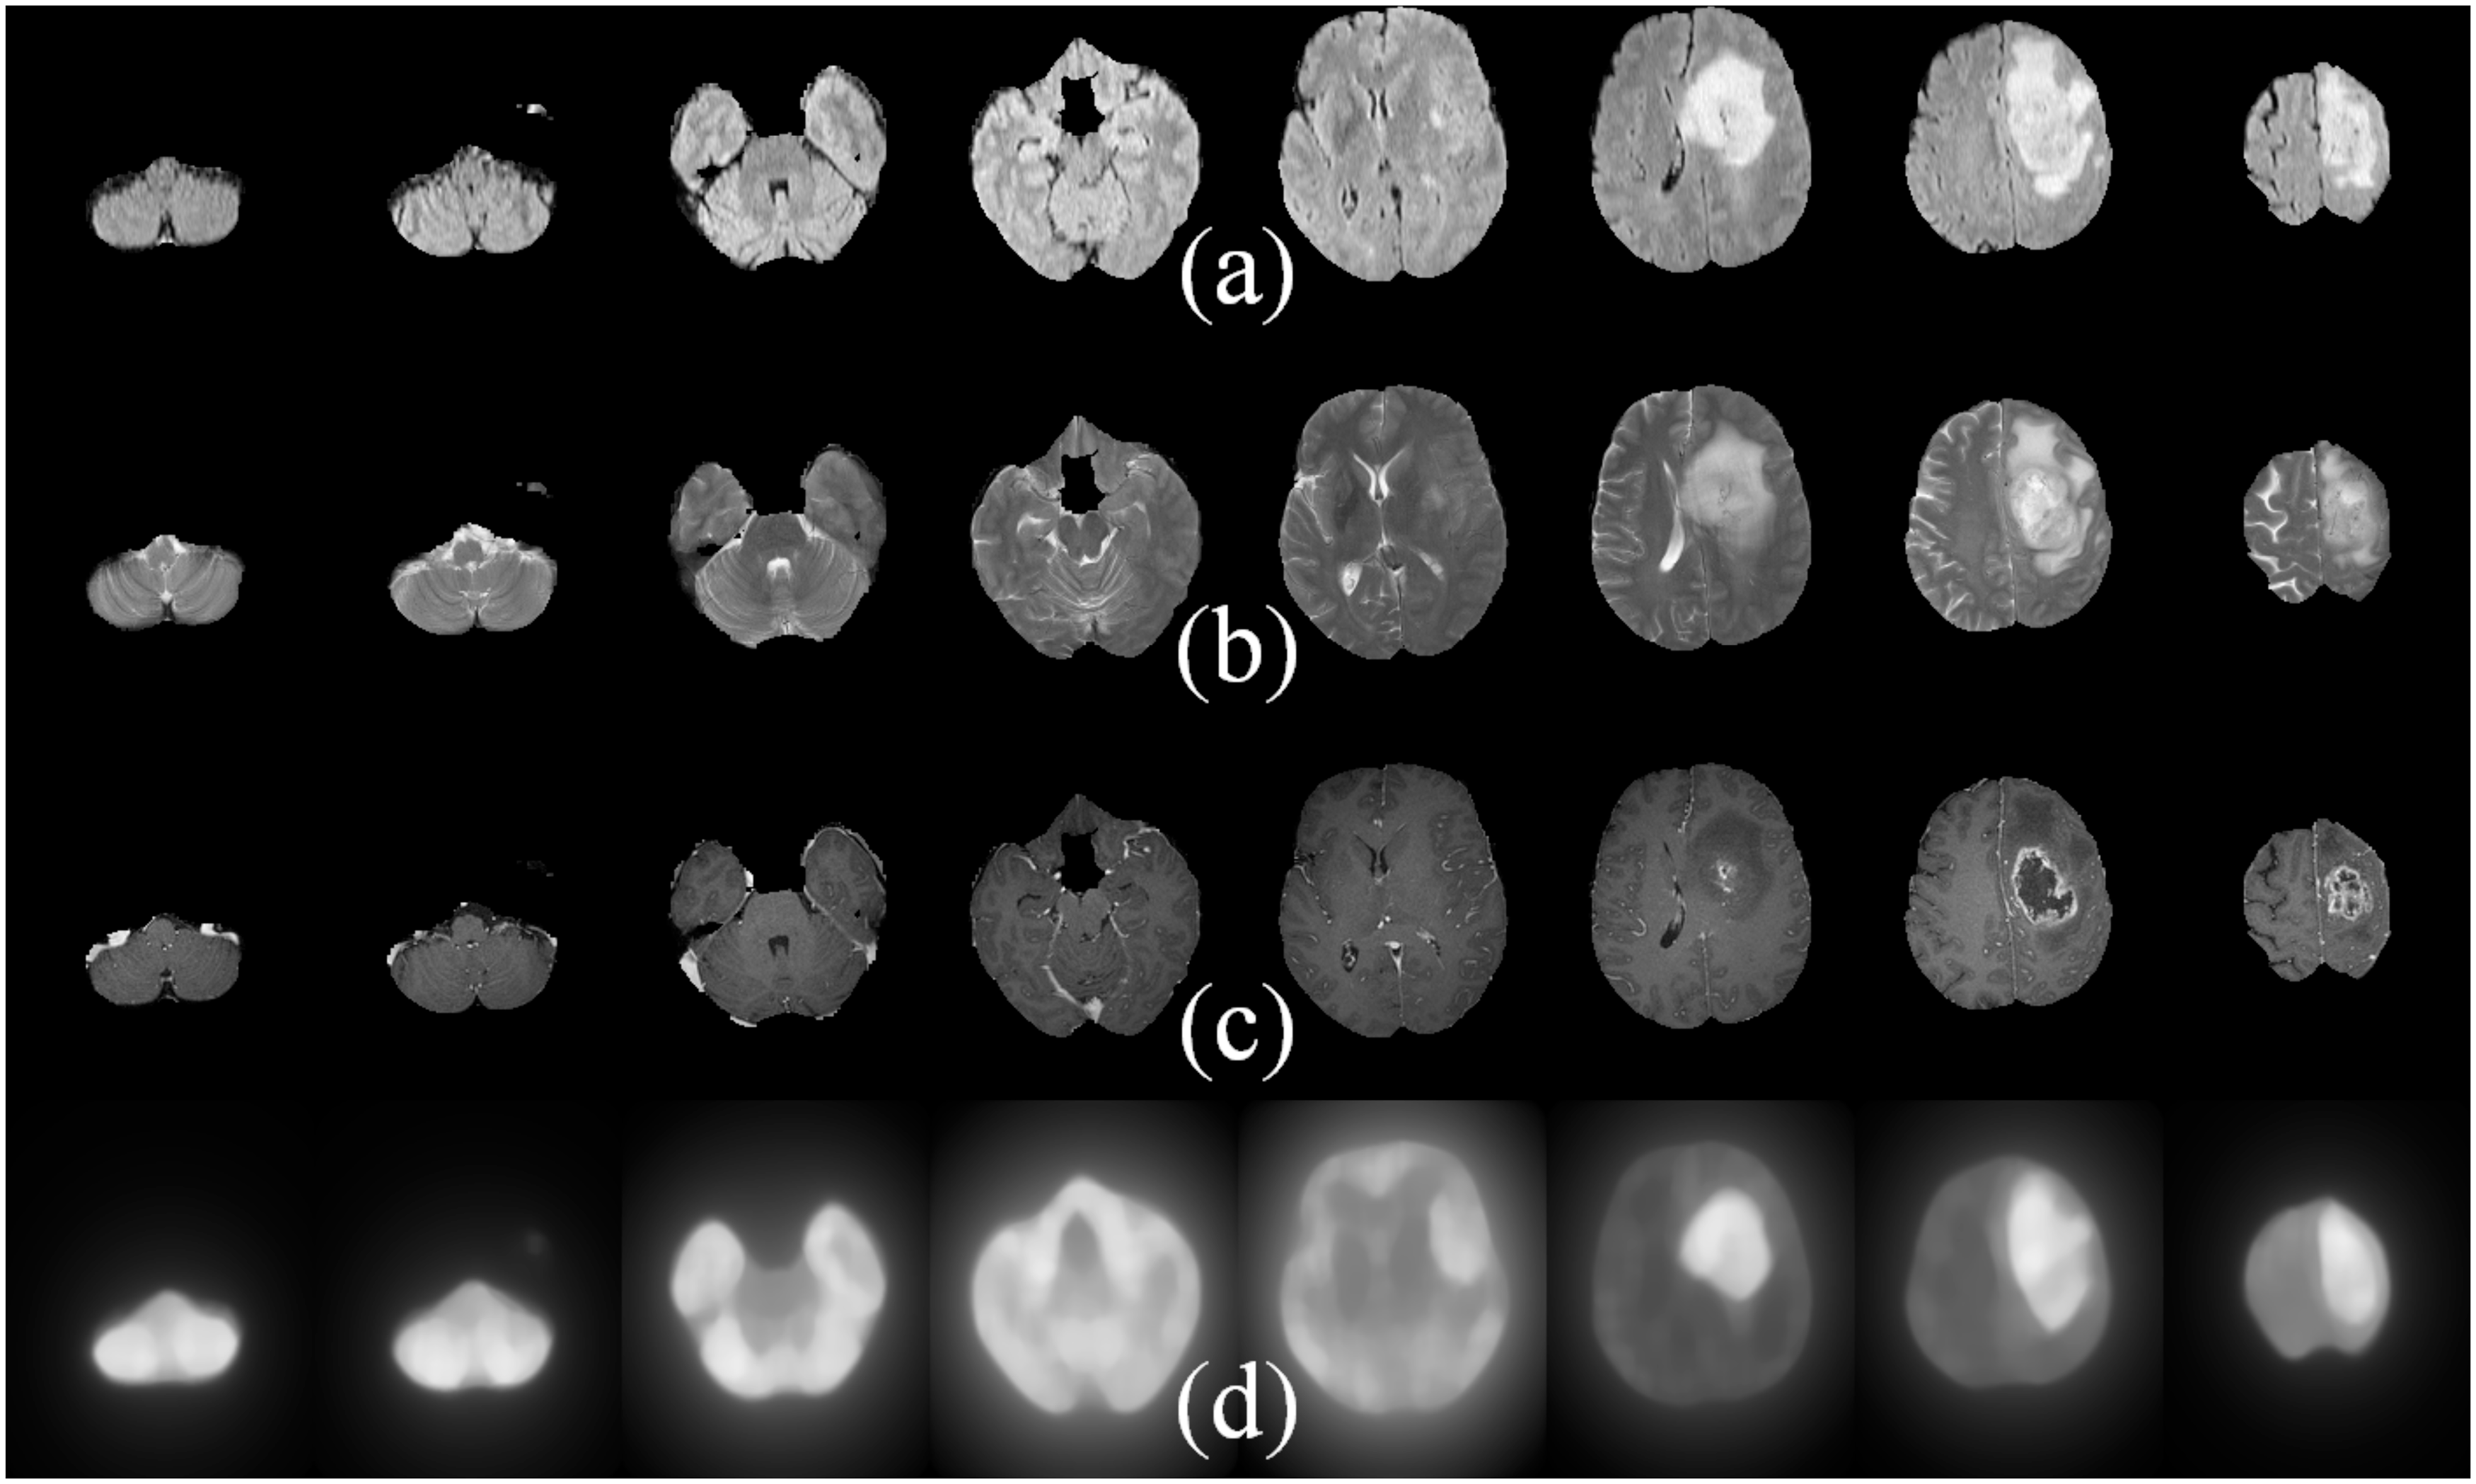
Considering the three RGB channels in order, FLAIR MRI sequence was loaded into the R channel, the T1C sequence was mapped into the G channel and T2 into the B channel. The resulting 48 bit colour image is utilised for all future processing.
One of the major bottlenecks of this approach is the resultant pixel values, which are individually difficult for the machine to interpret and display. This hampers the prominence of the end result and berates the validity of the algorithm. Saliency with respect to brain tumours being essentially described by how prominently the glioma region can stand out from the rest of the brain matter, it requires human comprehension. Without the distinctions being discernible to the human eye, it is impossible to assess the pragmatism of this algorithm; especially as an aid to medical practitioners. Therefore we enhance each channel by uniformly distributing the 8 bits of each singular RGB channel to the spectrum of intensities upto the existential maximum intensity value. This increases the understandability, and generates a more visually apparent and highly accentuated saliency map.
In order to maximise the accuracy of the salient region, each MRI sequence is normalized to enhance hidden characteristics and boundaries. Then the processed image is converted to its corresponding Lab* format, which is useful in increasing the perceivability of the various colour components associated. It helps enhance the luminosity and chromaticity of an image with respect to each other.
Another issue which cropped up during the development of this procedure was the volume-wise voxel saliency generation. While it is relatively easier to generate the saliency map for a 2D image, the complexity increases in the 3D space. This is because in 3D the computation of the degree of saliency depends not only on the neighbourhood voxels of the same plane, but also on those of all other intersecting planes. Hence those slices containing insignificant portions of the tumor may adversely affect the degree of saliency of the VOI. Moreover brain MRI sequences are not always perfect, with many images in the database having unwarranted intrusion of light along one or more axes .
To overcome this difficulty we used all three major planes, viz. xy, yz, and xz planes, to calculate the average saliency. Using a cubic scaling factor k = 4, 8, and 16, each 3D image space was broken down into cubes of its respective sizes. For example, size 4 cubes had the information of its 64 neighbours imbibed into one single voxel. Thereby we could successfully achieve our objective using only the three major axes, with the neighbourhood information getting extracted from the voxel intensity.
At the same time it is important to generate a uniform breaking down mechanism to serve as a viable decomposition tool for all images. Since the 3D images in the sourced database are of varied sizes, we transmute it into a dimensional scope of M × M × N, where M and N are divisible by k (k = 4, 8, 16). Thereby, the entire 3D image volume is broken down into three separate groups representing volumes of size 4 (64 pixels), 8 (512 pixels) and 16 (4096 pixels) respectively. Each non-overlapping cube is represented by its mean Lab* values, thus decomposing it into a single unit with the values from its surrounding pixels stored as its integral property. The number of cubes correspond to the number of pixels in the saliency map, which would be of dimension (M/k × M/k × N/k) with each cube being of size (k × k × k). Therefore, the ith cube of the image I(Vi), 1 ≤ i ≤ (M/k × M/k × N/k), can be represented by its mean Lab* value .
The ability to effectively discern the glioma from the rest of the brain matter is an essential parameter to be considered in this algorithm. The salient features of the image are ascribed to the superimposition of the three MRI channels which accentuate the region of the tumour. Therefore the saliency of each cube is compared with the variegation of colours with respect to all other cubes along the major planes (xy, yz, xz) of the image. Utilizing the simplest of all approaches, the basic difference between the mean Lab* colour values of each such cube pair is represented using the Euclidean norm. This allows mapping the pseudo-colored cube pairs, graded on a normalized scale of 0–255 shades, to enhance the colour difference over each individual channel. Generating a basis for colour difference also helps in finding a common ground for perpetuating and representing any visually apparent change in the composition of each cube.
Since the evaluation of saliency Sc for each k × k × k voxel Vi,j,l is performed only along either of the three major axes (at a time), while excluding Vi,j,l itself during distance computation.
Technologies Used
Matlab
BRATS data