CLASSIFICATION OF EEG AND MUSIC GENRE DATA USING DEEP LEARNING
1. Frequency Bandwidths
The EEG signals have a broad frequency bandwidth, but what are usually focused on clinically are those between 0.5-35 Hz. Empirically, they are sorted as follows:
a) δ rhythm, with a frequency between 0-4 Hz, is usually associated with the deep stage of sleep, also known as slow-wave sleep.
b) θ rhythm, has a frequency between 4-7 Hz. Cortical θ rhythm is observed frequently in young children. In older children and adults, it tends to appear during meditative, drowsy, or sleeping states, but not during the deepest stages of sleep. Several types of brain pathology can give rise to abnormally strong or persistent cortical θ rhythm.
c) α rhythm, is neural oscillation in the frequency range of 7.5-12.5 Hz. It
predominantly originates from the occipital lobe during wakeful relaxation with closed eyes, and is reduced with open eyes, drowsiness and sleep.
d) μ rhythm, at a frequency of 7.5-12.5 Hz, is most prominent when the body is physically at rest. It is found over the motor cortex, in a band approximately from ear to ear. It is suppressed when the body performs a motor action or, with practice, when the subject visualizes performing a motor action.
e) β rhythm, with a frequency range of 12.4-30 Hz, is associated with waking consciousness, especially with active, busy, or anxious thinking and active concentration.
2. Features of EEG Signals
a) The EEG signals are faint compared to the interference signals, such as the signals of blinking eyes, mental or muscular tension.
b) The signals have complicated components. Besides EEG, there are a large number of other signals like electrocardiogram (ECG). Some of the interference signals have been explained, while some are still remained unrecognized.
c) The EEG signals have a clear spectrum feature, under the condition of which, methods based on spectrum analysis are well applied.
d) The EEG signals are non-stationary stochastic process. Its randomness and non-stationarity derive from not only the irregular activities of the related physiological structures, but also the reaction to the unexpected changes in the environment. Thus the statistical methods, such as time series analysis should be considered.
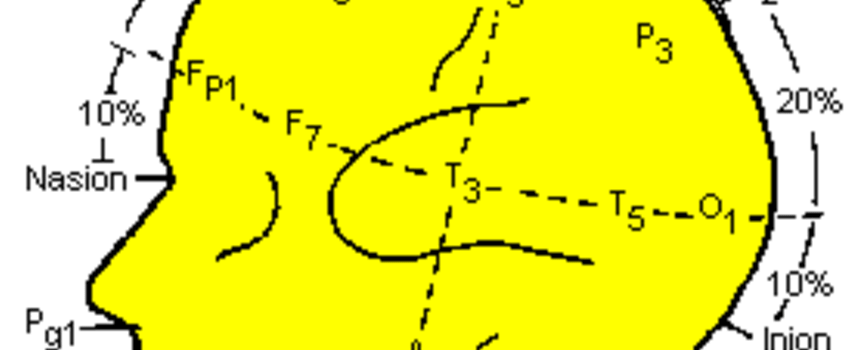
3. “10-20” System of Electrode Placement
This system is to depict the location of the electrodes (which are a part of the head gear) on the scalp and the cerebral cortex area that lies beneath the scalp. 10-20 refers to the distance between two electrodes. These electrodes are used to record the brain signals using electroencephalograph.
Every point on the fig. depicts a possible position for an electrode. Every position will have a letter (to represent the lobe) and a no. or some other letter to represent the hemisphere location. The letters F, C, T, O, and P represent Frontal, Central, Temporal, Occipital and Parietal. (Note that there is no "central lobe", but this is just used for identification purposes.) Even nos. (2,4,6,8) generally depict the right hemisphere and odd nos. (1,3,5,7) depict the left hemisphere. The z represents an electrode located on the middle line. Also smaller the number in magnitude, the closer the location is to the middle line. Nasion is the point that falls between the forehead region and the nose whereas Inion is the bump at the back of the skull.
CLASSIFICATION OF EEG SIGNALS USING MACHINE LEARNING TECHNIQUES
1. Data Collection
The data was collected with the students and faculty of BITS Goa being the subjects. The whole setup is made ready by testing it several times since the experiment should not fail midway. There is no substitute for clean data which can be produced only if the data collection is performed with utter care.
For the execution of collection of data, the subject is advised to wash their hair and neither apply any product on the hair nor face so that those products don‘t act like a shield between the electrodes and your skin. After this a small napkin is wrapped around your shoulder for cleanliness and a mixture of shampoo and alcohol (KCl in our case) in water is applied to the places where the electrodes shall be placed. The alcohol is applied to reduce the impedance of skin in those areas so that neural signals can be captured easily. After wearing the headgear one looks like the picture shown below.
For performing the experiment the headgear gets connected to the electroencephalograph and the subject is made to sit in a shielded room in which he will be the only person present, however the experimenter can enter the room whenever required. The first experiment is about looking at the left/right LEDs or nowhere as per the instructions heard from the Headphone. The instructions were ―LEFT , ―NOWHERE and ―RIGHT and also it is advised not to blink while looking Left/Right, although nowhere does mean that one can relax their eyes by blinking. The next experiment is the same but instead of the instructions being heard from the headphone, one has to hear it from the experimenter himself. And the third experiment is to blink thrice whenever the instruction of ―BLINK is given.
In this way the data collection for one person is carried out and the brain signals of the person while performing these tasks are recorded.
Data Processing; Feature Extraction
Following is a description of data processing techniques used in this project.
Hanning Window: First the data were chopped up into overlapping 1-second ‘frames’ and a Hanning window was applied.
Fast Fourier Transform(FFT): FFT was applied to transform data for each frame from time domain to frequency domain.
Frequency Binning: FFT amplitudes were grouped into theta(4-8Hz), alpha(8-12Hz), and beta(12-40Hz) ranges, giving 3 scalar values for each probe per frame.
2D Azimuthal Projection: These 3 values were interpreted as RGB color channels and projected onto a 2D map of the head.
Feature extraction is an important step in the process of electroencephalogram (EEG) signal classification. We propose a “pattern recognition” approach that discriminates EEG signals recorded during different cognitive conditions. Wavelet based feature extraction such as, multi-resolution decompositions into detailed and approximate coefficients as well as relative wavelet energy were computed. Extracted relative wavelet energy features were normalized to zero mean and unit variance and then optimized using Fisher's discriminant ratio (FDR) and principal component analysis (PCA). A high density EEG dataset validated the proposed method (128-channels) by identifying classifications:
EEG signals recorded during a baseline task (eyes open). Classifiers such as, K-nearest neighbors (KNN), Support Vector Machine (SVM), and Naïve Bayes (NB) were then employed.
Pre processing techniques such as PCA are employed into the process, and is an excellent dimensionality reduction technique, which helped reduce dimension of the vector data onto projection in 2 vector planes.
Implementation
K - Nearest Neighbor Algorithm
In pattern recognition, K-nearest neighbor (k-NN) is a non-parametric or linear method used classification and regression of EEG datasets as the third classifier in this research work. Different feature values are fed to the k-NN and the classification accuracy has been determined.
The output of class by an object is classified by a majority vote of its neighbors. The object is assigned by its k nearest neighbors. If k = 1, then the object is locating the nearest neighbour in instance space and labelling the unknown instance with the same class label as that of the located (known) neighbour. A higher value of k results in a smoother, less locally sensitive function.
Support Vector Machine Algorithm
SVM is a powerful approach for pattern recognition especially for high dimensional, nonlinear problems. SVM has achieved better classification results in mental task and cognitive task classifications.
Recent developments on SVM have shown the need to consider multiple kernels. This provides flexibility and reflects the fact that typical learning problems often involve multiple, heterogeneous data sources. For appropriately designed kernels, the optimized combination weights can be used to understand which features are important for a specific recognition problem.
In this project, we applied the MKL-SVM algorithm to the classifications of mental task and cognitive task EEG signals.
It maps the input patterns into a higher dimension feature space through some nonlinear mapping where a linear decision surface is then constructed. In SVM, a kernel function implicitly maps samples to a feature space given by a feature mapping. Since there are different kernel types, it is often unclear what the most suitable kernel for a task at hand is, and hence the user may wish to combine several possible kernels. It is thus desirable to use an optimized kernel function that can fit the data structure well.
Discriminant analysis and SVMs have been used successfully in different MI-based Brain Computer Interface applications as they present an excellent empirical performance.
In SVM algorithms, the number of parameters that must be used is related to the number of training objects instead of the number of attributes.
In addition, to avoid the problem of overfitting the classifier and to reduce the sensitivity regarding the selection of training and testing sets, a cross-validation technique is needed.
Independent component analysis (ICA) is a kind of blind source separation technique that extracts statistically independent sources called independent components from a set of recorded signals.
Empirical model decomposition (OEMD) is a self-adaptive signal processing and data driven method. Compared with classical time-frequency analysis methods, such as short time Fourier transform (STFT) and wavelet, it is based on the local characteristic time scales of a signal and could decompose the signal into a set of complete orthogonal components called intrinsic mode functions (IMFs) which are determined by the signal itself without prior knowledge about the signal.
RESULTS
The results obtained are encouraging. Without even using a recurrent neural network (which is the next logical step), the CNN is able to correctly classify the test subject’s brain-state about 8.5 times out of 10.
This is likely high enough to enable a new level of performance with brain-computer interface (BCI) technologies.
However, the best results were obtained when the network was trained on samples from the same recording session. While this may be practical for basic brain research, it would be less practical for use in BCI technology.
The results obtained suggest that while EEG signals do indeed generalize between individuals, there are still significant variations between individuals, which is an unsurprising finding.
This further suggests that using EEG for BCI will likely require an iterative approach of training on a large population and then fine tuning on a specific individual. It is therefore recommended that future research be done on the possible application of Transfer Learning techniques to the classification of EEG signals.
Technology Used:
Technologies used will be as follows:
1.Intel Optimized Python
2.Intel Optimized TensorFlow.
3.Scikit-Learn implementation for K-NNs and SVM
4.OpenVINO toolkit
5.Final prototype will be deployed on Intel Movidius to make it portable and affordable.