Water Quality Prediction (OneAPI Online Hackathon)
Intel OneAPI Online AI Hackathon
"Water Quality Prediction"
TEAM DESCRIPTION
Vinay Vaishnav: Pre-final Year (B.Tech. Electrical Engineering)
Tanish Pagaria: Pre-final Year (B.Tech. Artificial Intelligence & Data Science)
IIT Jodhpur Undergraduates
PROBLEM STATEMENT
Freshwater is one of our most vital and scarce natural resources, making up just 3% of the earth’s total water volume. It touches nearly every aspect of our daily lives, from drinking, swimming, and bathing to generating food, electricity, and the products we use every day. Access to a safe and sanitary water supply is essential not only to human life, but also to the survival of surrounding ecosystems that are experiencing the effects of droughts, pollution, and rising temperatures. We need to use the freshwater quality dataset to check the suitability of water for consumption.
Dataset link
https://www.kaggle.com/datasets/naiborhujosua/predict-the-quality-of-freshwater
Drive link to the files used or created during the project
https://drive.google.com/drive/folders/18Dg9FfzS2IPDBFLKcG8oY5yKIdNglbhn?usp=drive_link
GitHub repository link
https://github.com/VinayVaishnav/Water_Quality_Prediction
DATA ANALYSIS, VISUALIZATION, AND PREPROCESSING
The provided dataset comprised 59,56,842 data points, with 22 feature columns and 1 column showing the target labels (sustainability of the sample). The dataset consisted of water samples collected from various water sources at different times of the day and parts of the month.
|
Water sustainability |
No. of data points (out of 59,56,842) |
|
Not sustainable (Target:0) |
41,51,590 (69.69%) |
|
Sustainable (Target:1) |
18,05,252 (30.31%) |
Features in the dataset (Parameters used in the water data collection)
-
pH level
-
Iron, Nitrate, Chloride, Lead, Zinc, Fluoride, Copper, Sulfate, Chlorine, and Manganese contents
-
Color
-
Turbidity
-
Odor
-
Conductivity
-
Total dissolved solids
-
Source
-
Water and air temperatures
-
Month, date, and time of the day of sample collection
Categorical features of the dataset
-
Colors: Colorless, Near colorless, Faint yellow, Light yellow, Yellow
-
Sources: Lake, River, Ground, Spring, Stream, Aquifer, Reservoir, Well
-
Months: All months of the year (Jan. to Dec.)
-
Days: All days of a month (1 to 31)
-
Time of the day: All hours of the day (0 to 23 hrs)
Important observations in the dataset
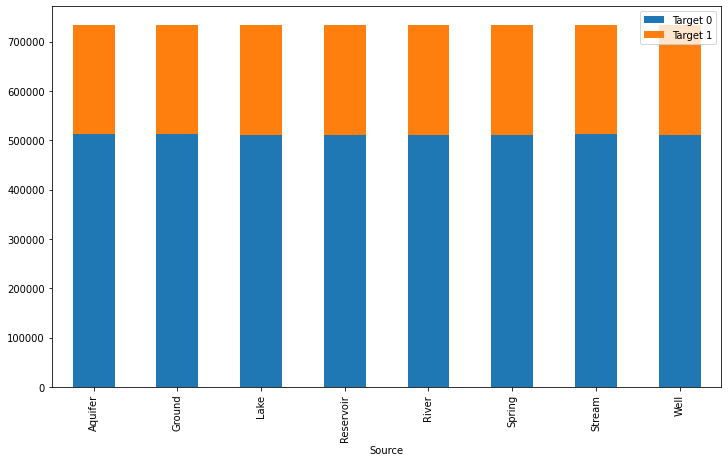
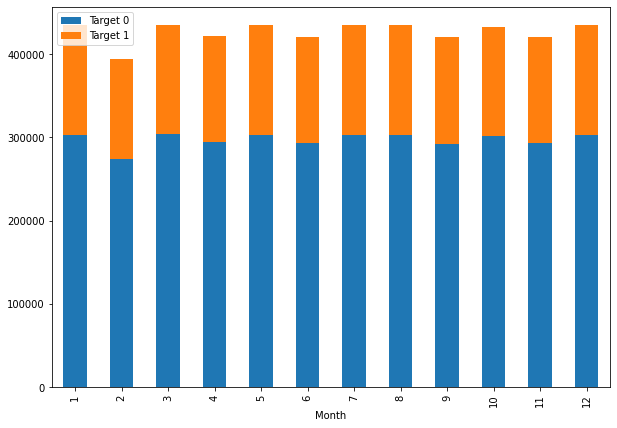
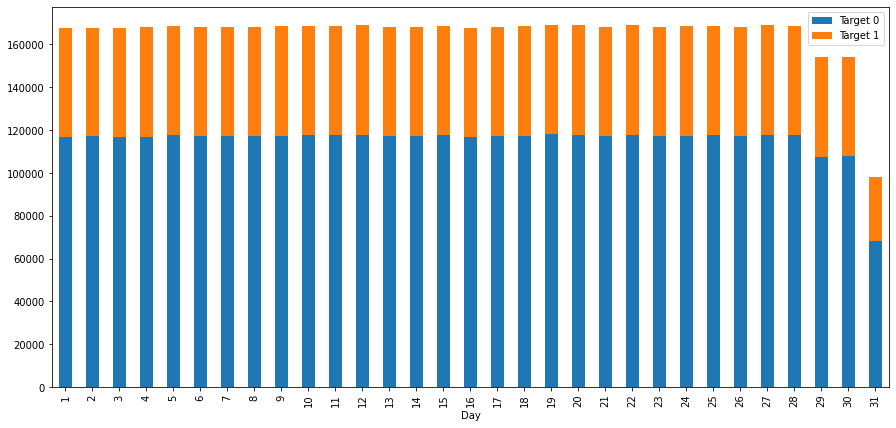
The categorical features in the dataset: source, month, day, time of the day; showed great uniformity in the number of data points for each category. The uniformity was consistent, even with the target labels.
Example:
Correlation of each feature with the target labels
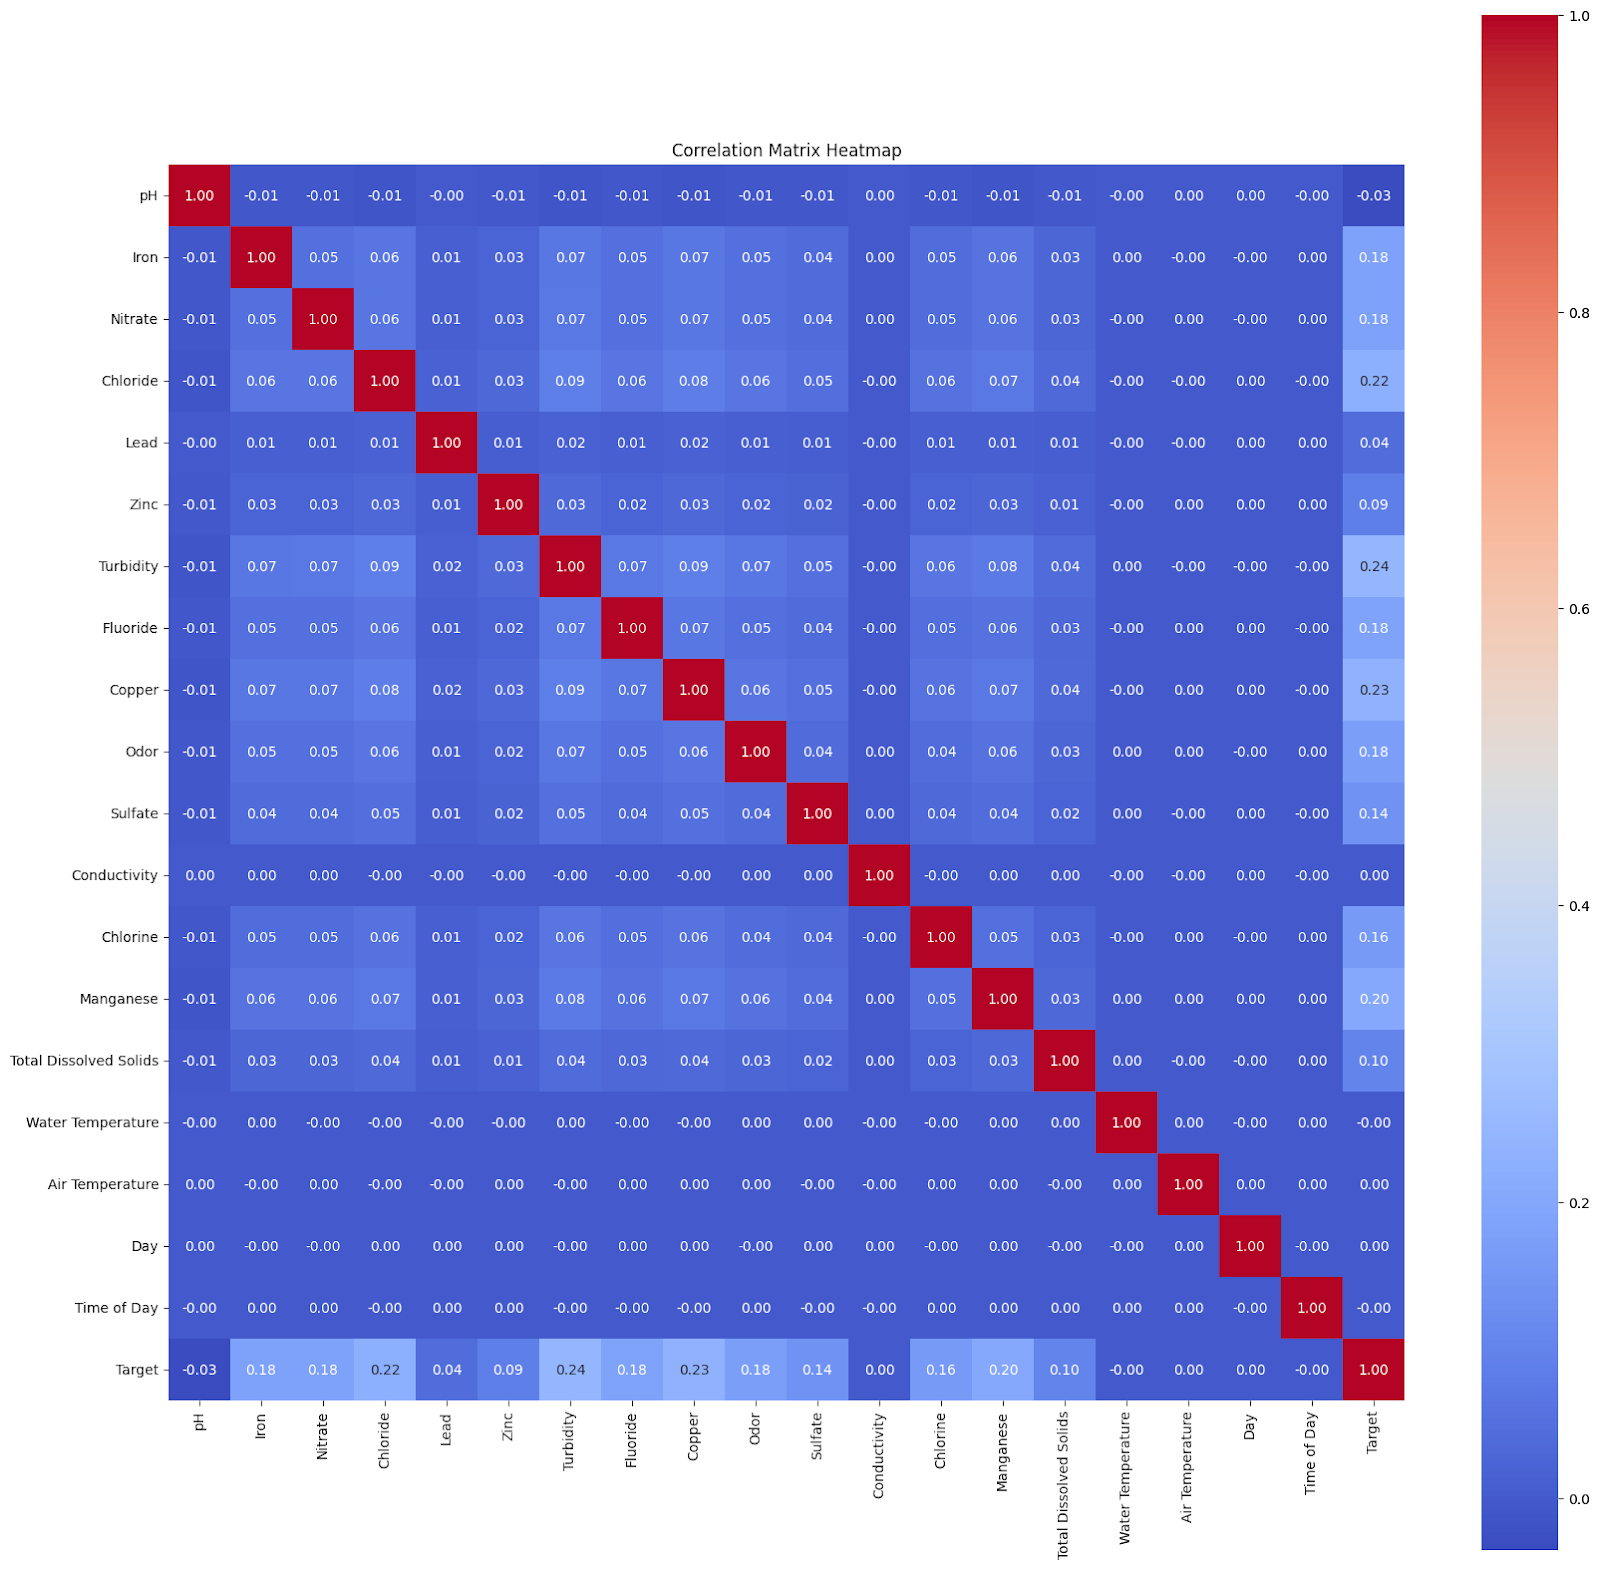
We observed that there was no significant mathematical correlation between the target label column and any of the features. Hence, there was a requirement for in-depth analysis of the dataset.
Issues encountered with the dataset
-
A large number of NaN or NULL (missing) values (around 20 lakh rows with missing values out of the 59 lakh data points)
-
Finding the importance of each feature for sustainability
-
Cleaning the data
-
High dimensionality of the dataset that would lead to increase in computation and model training time
Cleaning the data
Criteria for dealing with the missing values:
-
If the number of missing values in a feature column was not significant (less than or around 1 lakh data points), the missing value rows were dropped.
-
Otherwise, on the basis of graphs, if most of the data points of a feature were concentrated over a smaller range of values, the missing values were filled with the overall mean of the feature column.
-
In other cases, the missing value rows were dropped / removed from the dataframe.
|
|
|
|
|
|

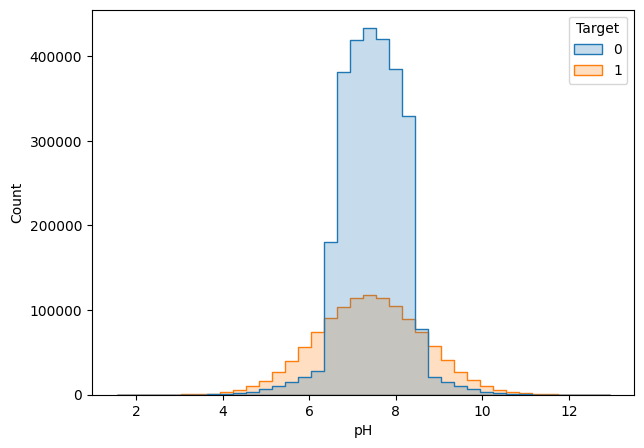
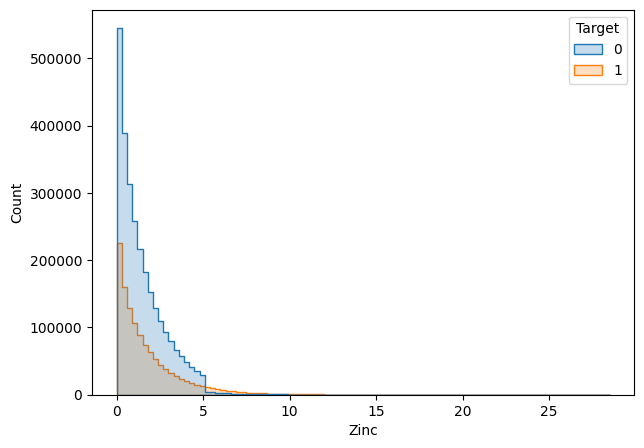
The cases shown above are the cases where the missing values were filled in with the overall mean of the feature column.
|
|
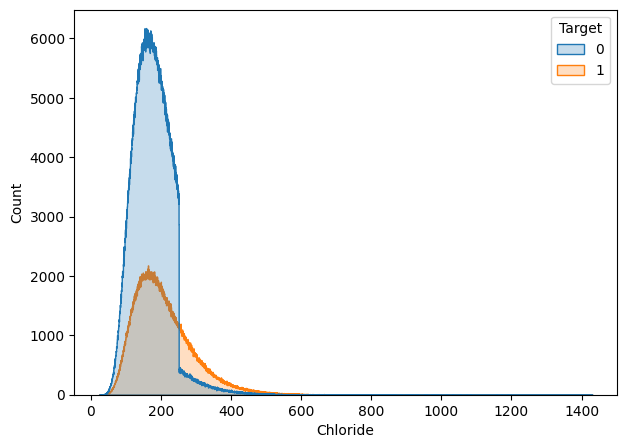
|
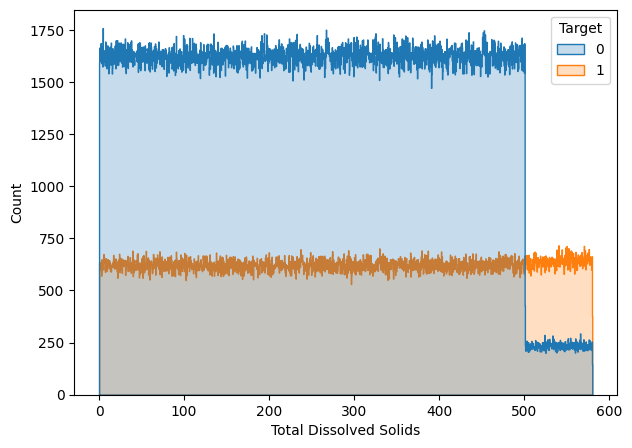
The cases shown above are those where data points were in a wider range of values. Hence, we removed the rows that contained null values for these features.
|
|
|
|
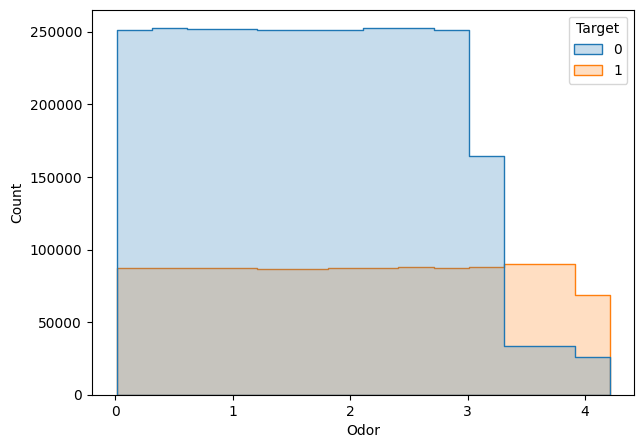
|

The above shown features contained a uniform distribution of data points for both target labels; hence, we could not fill the missing values with any particular value, so we decided to remove the rows that contained the missing values in these cases.
AFTER PREPROCESSING
After the data analysis and preprocessing were performed, the problem statement was reduced to a Binary Classification problem of identifying whether a given sample of water is sustainable or not. We were left with around 51 lakh data points after the data cleaning and imputation.
TECHNOLOGICAL ASPECT AND METHODOLOGY
Observing the size of the remaining dataset, we saw the Intel® AI Analytics Toolkit (by oneAPI) as a great solution for optimizing the problem solving process. The Intel AI Analytics Toolkit is a collection of frameworks and tools designed to accelerate data science and analytics pipelines on Intel® architectures. It is constructed using OneAPI libraries to optimize computations.
It offers a large number of packages that we can easily integrate into our standard Python codes to optimize the process and reduce the computation time.
Intel AI Analytics Toolkit packages used in our project
-
Intel Extensions for Scikit-learn and XGBoost
-
oneDNN (Intel oneAPI Deep Neural Network Library)
To improve the performance of PyTorch framework
To deal with the high dimensional tabular data, we proceeded by using simpler machine learning models at first that could generate results in low computational time, and then, we moved towards more complex machine learning and deep learning models. The dataset was divided into 70:10:20 (train : validation : test) for the model training.
The following models were employed in the specified order, one after the other:
-
Logistic Regression
-
It provides interpretable coefficients, which can help understand the influence of each feature on the target variable.
-
It is a simple and fast model that can serve as a baseline for more complex models.
-
Logistic regression can handle high-dimensional datasets efficiently.
-
Decision Tree
-
Decision trees can capture non-linear relationships between features and the target variable.
-
They can identify important features through feature importance scores.
-
XGBoost (Gradient Boosting)
-
XGBoost is known for its high predictive accuracy due to its ensemble nature.
-
It can capture complex non-linear relationships in the data.
-
It handles missing data well and is less prone to overfitting.
-
XGBoost provides feature importance scores, aiding in feature selection.
-
Multilayer Perceptron (MLP)
-
MLPs are a type of neural network capable of learning intricate patterns in high-dimensional data.
-
They can handle large and complex datasets.
-
Neural networks can automatically learn relevant features from the data.
-
TabNet
-
TabNet combines the power of neural networks with attention mechanisms, making it interpretable and suitable for tabular data.
-
It provides feature importance scores through the attention masks.
-
TabNet is designed to handle noisy data and can be more stable than traditional deep learning models.
Metrics used for judging the model performance
We chose to use F1 Score as the evaluation metric for the binary classification on the high-dimensional tabular dataset. The F1 score is a metric used to evaluate binary classification models. It combines two important measures: precision (accuracy of positive predictions) and recall (sensitivity to actual positives), into a single value.

A high F1 score (closer to 1) indicates a model that balances precision and recall well, while a low score (closer to 0) suggests that the model struggles with one or both of these aspects. It's valuable for assessing how effectively a model identifies positives while avoiding false positives, especially in imbalanced datasets or when the costs of errors vary.
-
F1 score balances precision and recall, making it suitable for imbalanced datasets.
-
It's robust against challenges posed by high-dimensional data, like overfitting and noisy features.
-
Encourages models to focus on minority classes, avoiding accuracy-driven over-optimization.
Results obtained from all the models:
|
Model (trained on the train set) |
Accuracy Score (on the test set) |
F1 Score (on the test set) |
|
Logistic Regression |
79.02% |
0.5931 |
|
Decision Tree |
83.03% |
0.7179 |
|
XGBoost |
86.37% |
0.7961 |
|
Multilayer Perceptron |
83.94% |
0.7581 |
|
TabNet |
87.28% |
0.8155 |
From the results, we observed that TabNet provided the best results out of all the models used.
More about "TabNet"
TabNet was proposed by the researchers at Google Cloud in 2019. The idea behind TabNet is to effectively apply deep neural networks to tabular data, which still consists of a large portion of users and processed data across various applications such as healthcare, banking, retail, finance, marketing, etc.
TabNet provides a high-performance and interpretable tabular data deep learning architecture. It uses a method called the sequential attention mechanism to determine which feature to choose for high interpretability and efficient training.
Improving the performance further
Since it was a large dataset, we further tried ensembling multiple TabNet models to enhance predictive accuracy and generalization.
-
Ensembling multiple TabNet models enhances predictive accuracy and generalization.
-
Ensembles reduce the impact of individual model weaknesses and errors.
-
Combining different TabNet models captures various aspects of the data, improving overall model performance.
-
Ensemble methods reduce overfitting by smoothing out individual model predictions.
|
Model (trained on the train set) |
Accuracy Score (on the test set) |
F1 Score (on the test set) |
|
Ensembling TabNet Models |
87.39% |
0.81786 |

Confusion Matrix for the Ensembled TabNet Model
Despite the performance scores being so close to the normal TabNet model, we did achieve slightly better performance, and considering the high dimensionality of the data, a small change in accuracy score means thousands of more data points getting identified.
ROLE OF INTEL AI ANALYTICS TOOLKIT
-
Intel Extension for Scikit-Learn and XGBoost
-
sklearnex is an extension of scikit-learn that optimizes machine learning algorithms for faster execution on multi-core processors.
-
It involved simply replacing scikit-learn components with their sklearnex counterparts to reduce computation time while maintaining or improving model performance.
-
XGBoost is a gradient boosting library that efficiently uses CPU cores and can run on GPUs, offering speed improvements for gradient boosting tasks.


-
Intel Extension for PyTorch
intel_extention_for_pytorch is an extension that enhances PyTorch's speed by leveraging Intel's hardware acceleration capabilities.
Advantages of using the toolkit:
-
The tools collectively reduced the computation time and enhanced performance.
-
We could easily patch our pre-existing code by just adding two extra lines of code.
-
They had faster iterations, improved scalability, and the ability to tackle the high dimensional dataset.
-
Incorporating these tools streamlined our machine learning workflow, making it more efficient and scalable.
REFERENCES
To know more about the types of extensions, packages, and libraries in the toolkit:
https://www.intel.com/content/www/us/en/developer/tools/oneapi/onedal.html#gs.4lj2sh https://www.intel.com/content/www/us/en/developer/tools/oneapi/scikit-learn.html#gs.4lj0kq
For installation of the Intel packages:
https://intel.github.io/scikit-learn-intelex/
https://pypi.org/project/scikit-learn-intelex/
https://pytorch.org/tutorials/recipes/recipes/intel_extension_for_pytorch.html
For understanding the workings of Intel packages:
https://youtu.be/vMZNYP4e2xo?si=Arw_ILgs_-l_RUka
Regarding TabNets:
https://www.geeksforgeeks.org/tabnet/
https://paperswithcode.com/method/tabnet